Capital Cost Estimator
Contents
- 1 About
- 2 WARNING
- 3 Features
- 4 System Requirements
- 5 Download
- 6 Installation
- 7 General Usage Instructions
- 8 Cost Estimation Basis
- 8.1 Introduction
- 8.2 Accuracy and Purpose of Capital Cost Estimates
- 8.3 Cost Escalation (Inflation)
- 8.4 Calculation methods
- 8.5 Using a cost index
- 8.6 Cost Indexes in Engineering
- 8.7 The Factorial Method for Capital Cost Estimation
- 8.8 Lang factors
- 8.9 Detailed factorial estimates
- 8.10 Operating Costs
- 9 References
About
Capital Cost Estimator is a software that estimates Capital and Operating Costs for a Chemical Processing Plant based on data from the currently active flowsheet.
WARNING
This software should be used for educational purposes only!
The data and information within the software have been obtained from a wide variety of literature sources. While reasonable care has been exercised in the collection of data and testing of this software, the author of the software disclaims any warranty, expressed or implied, as to the accuracy or reliability of the data or calculations contained therein. Calculations from the software yield approximate results that may not be suitable for all applications. The software is designed for use by trained professional personnel and is not a substitute for sound professional judgment. It is the user's sole responsibility to validate the data presented by the software and to determine whether the program's results are accurate and suitable for any specific purpose. No guarantee of accuracy or fitness for any purpose is expressed or implied. The author strongly recommends that the data be checked against other sources and/or methods before use and application. The author shall not be held liable for any direct, indirect, consequential or incidental damages incurred through use of the data or calculations.
Features
- Capital Cost Estimation
- Yearly Operating Cost Estimation
- Saving/Loading of Cost Reports
- Compare multiple Cost Reports
- Import Data from DWSIM Simulation Files, COCO/COFE Flowsheet files and DESIGN II Excel Reports (standalone version only)
- Export results to DOC/ODT/XLS/ODS/PDF files
- Automatic mapping for selected equipment, product/raw streams and utilities
- Price correction based on CEPCI and IPC Cost Indexes
- Currency conversion
- User-defined Equipment, Materials and Utilities
System Requirements
- DWSIM Plugin Version: DWSIM 9.0.5 running on Windows, Linux or macOS
- Standalone Application Version: Windows/Linux with .NET Framework 4.8 or Mono 4.0 or newer
Download
Plugin for DWSIM Simulator
The Capital Cost Estimator Plugin for DWSIM Simulator is available to purchase for USD 149. The software license is non-transferable; once you download the plugin, you cannot redistribute it.
A lot of effort was put into making this software, in the hope that it will be helpful. You can support future developments simply by doing things the right way: please do not give this plugin away for free, and encourage your colleagues to download it through the official channel.
Click here to go to the download/purchase page: Capital Cost Estimator (DWSIM Plugin Version) Download Page
The Capital Cost Estimator Plugin is also part of DWSIM Pro.
Standalone Application
The Capital Cost Estimator (Standalone App Version) is available to purchase for USD 199. The software license is non-transferable; once you download the package, you cannot redistribute it.
Click here to go to the download/purchase page: Capital Cost Estimator (Standalone App Version) Download Page
Click here to download a demo version: Capital Cost Estimator (Standalone App DEMO Version) Download Page
Installation
DWSIM Plugin Version
Windows only: Unzip the downloaded package. Copy the DLL and PDB files to the "plugins" folder inside DWSIM's current installation directory.
macOS and Linux users can download a special DWSIM version that includes the plugin.
Running the plugin
Start DWSIM and open/create a flowsheet. Go to the "Plugins" menu, you should see a new item called "Capital Cost Estimator". Click on it and the plugin interface will be shown on the screen.
Existing Unit Operations and Material/Energy Streams will be mapped to Equipment, Materials and Utilities, whose parameters can be freely modified.
Standalone Application Version
Unzip the downloaded package and run the executable file.
General Usage Instructions
New/Load/Save
To create a new Cost Report, click on the "New Report" menu button. To load an existing report, click on the "Load Report" menu button. To save the currently selected report, click on the "Save Report" menu button.
Compare Reports
To compare the currently opened reports, click on the "Compare Reports" menu button.
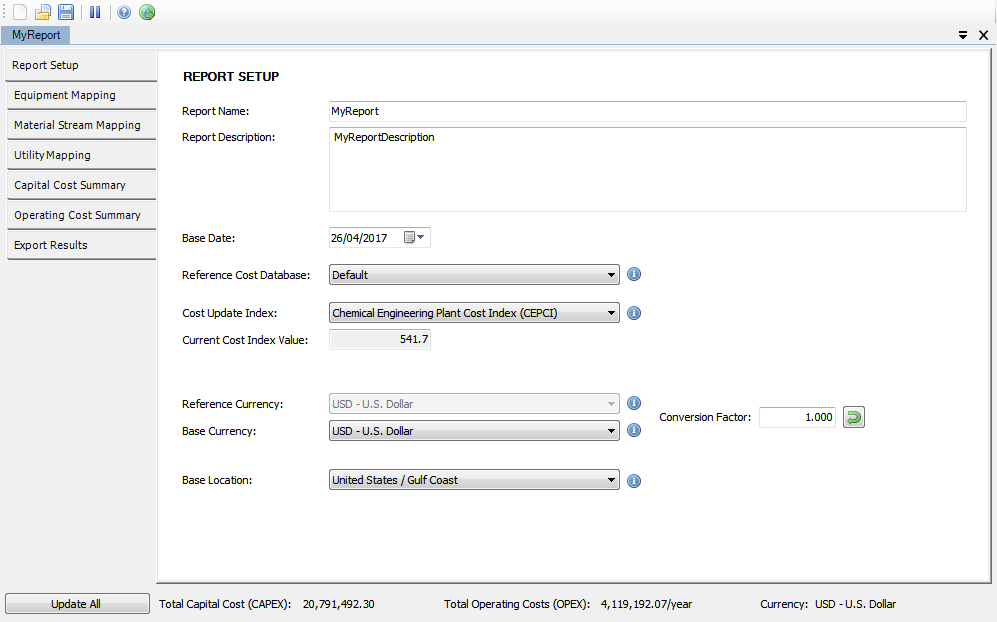
Report Setup
On this tab you will enter basic report information like name, description, reference date, cost index selection and currency details. The currency converter is based on a web service, which depends on an active internet connection to work.
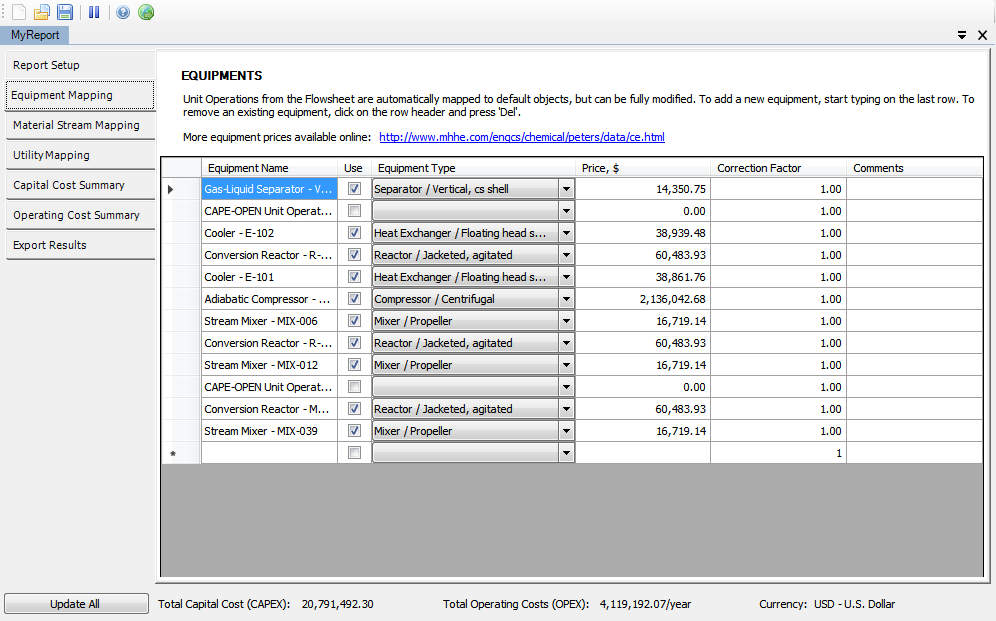
Equipment Mapping
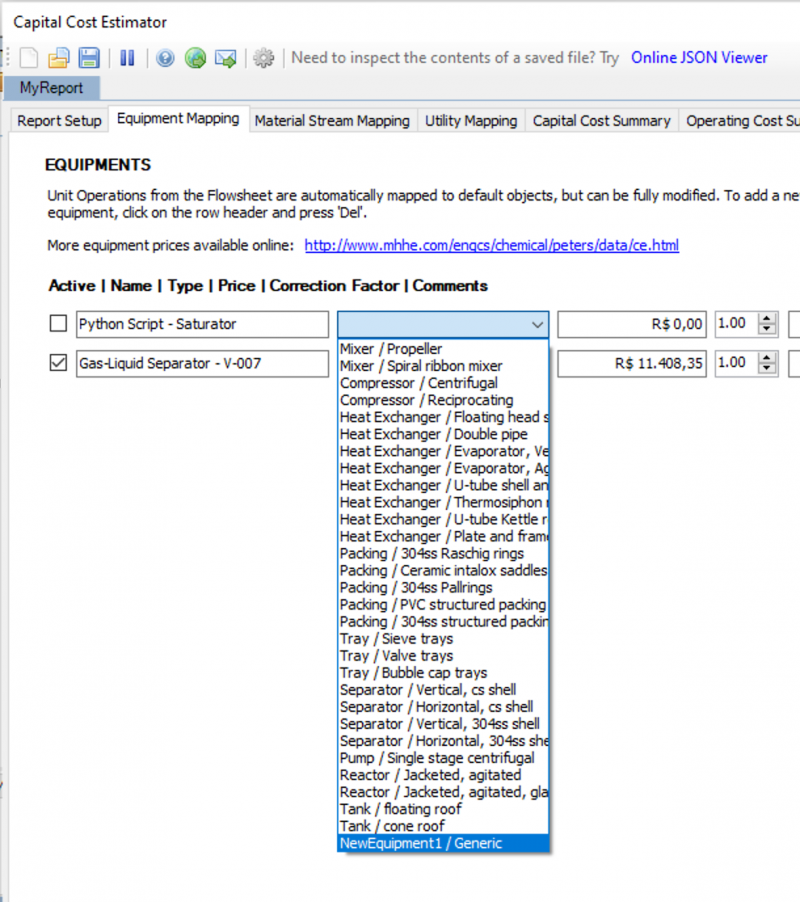
Some equipments are automatically mapped from Unit Operations, though you can modify the calculated values and change the selected equipments at any time. The correction factors are multiplied by the current prices to form the final total equipment cost.
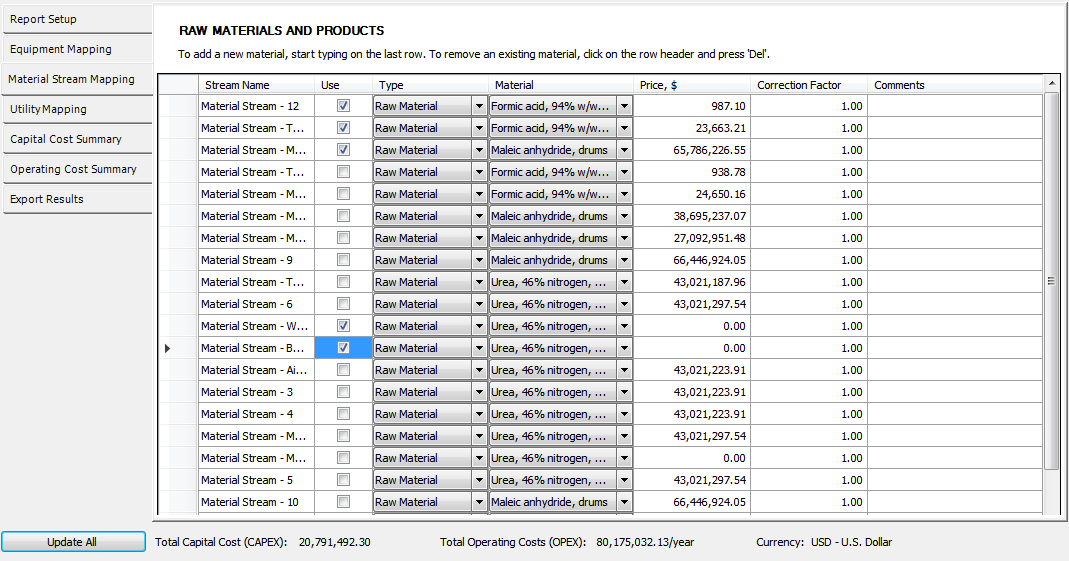
Material Stream Mapping
Material Streams can be mapped to Raw Materials and/or Products, which will be used to calculate Yearly Operating Costs.
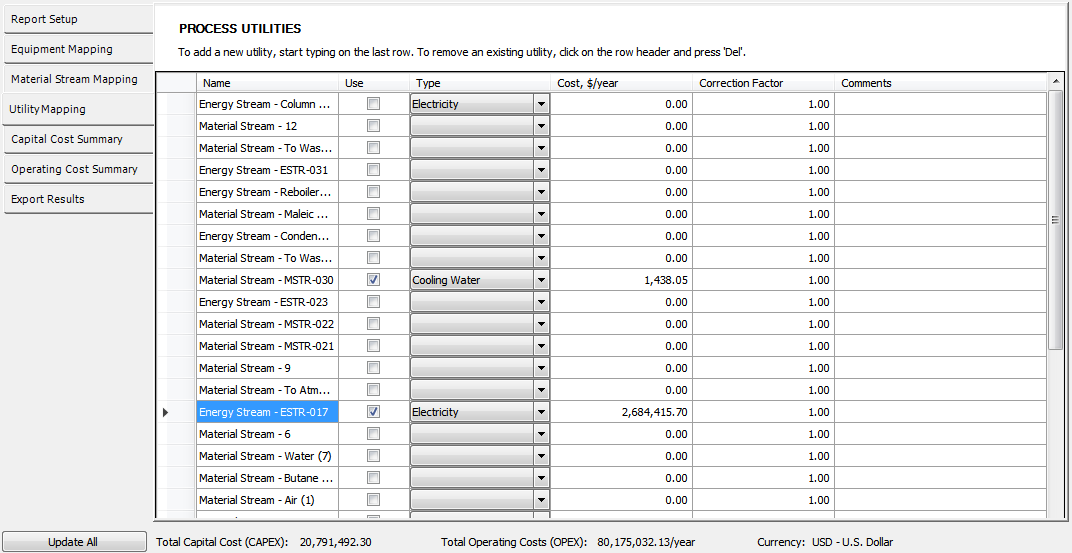
Utility Mapping
You can map Material and Energy Streams to some predefined Process Utilities, and the plugin will automatically calculate the cost based on the mass or energy flow, depending on the stream type.
Capital Cost Summary
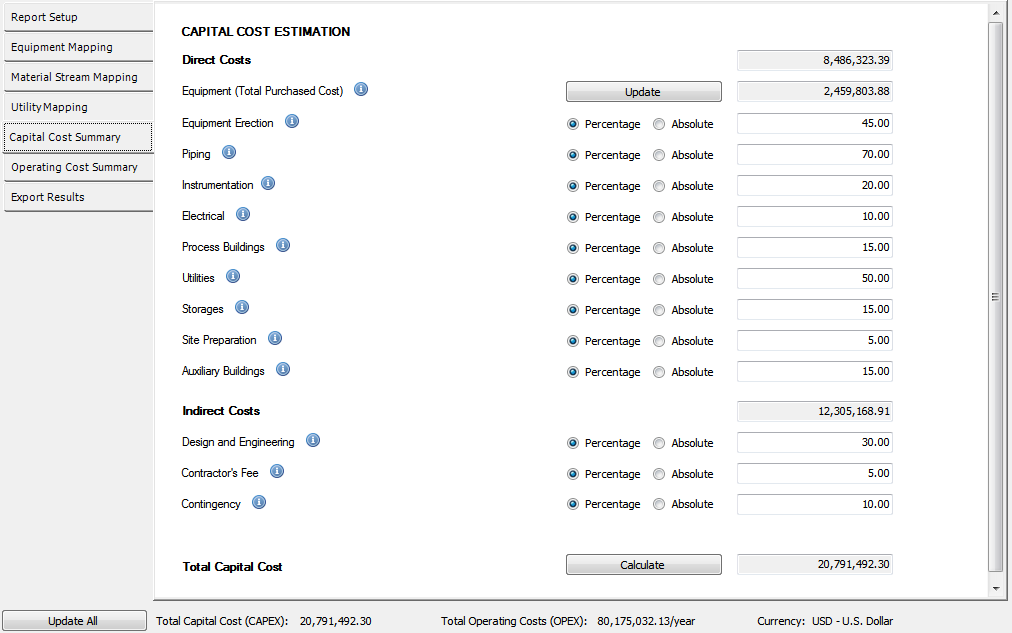
Here you'll see a summary of the items that make up the Total Capital Cost. You can change the calculation basis (Percentage or Absolute value) for most items, except for those who are calculated based on the previously mapped items.
Yearly Operating Cost Summary
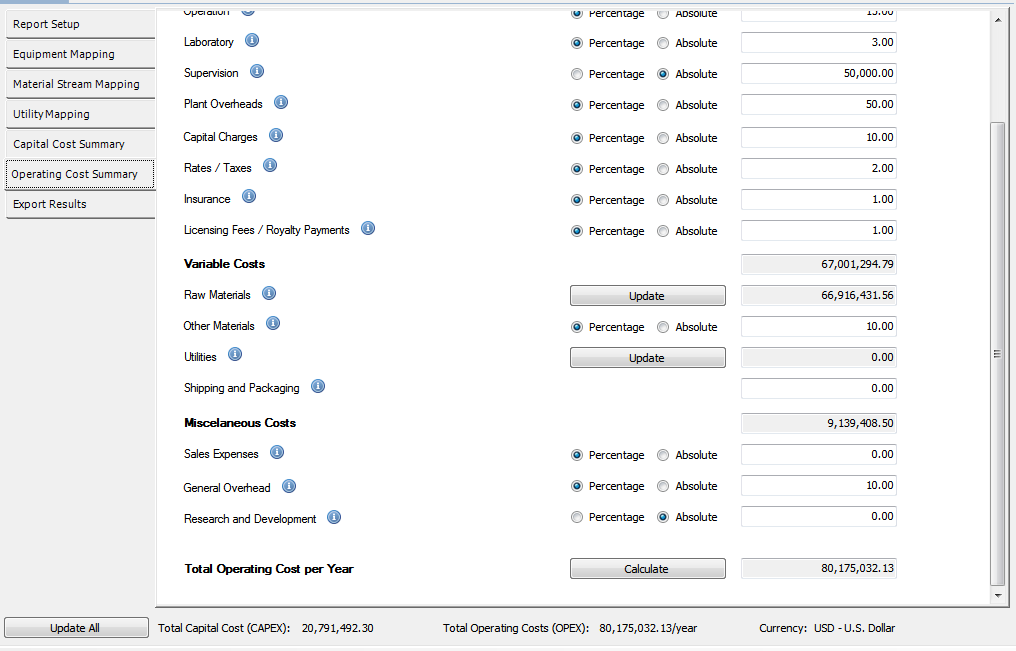
Here you'll see a summary of the items that make up the Total Yearly Operating Cost. You can change the calculation basis (Percentage or Absolute value) for most items, except for those who are calculated based on the previously mapped items.
Export Results
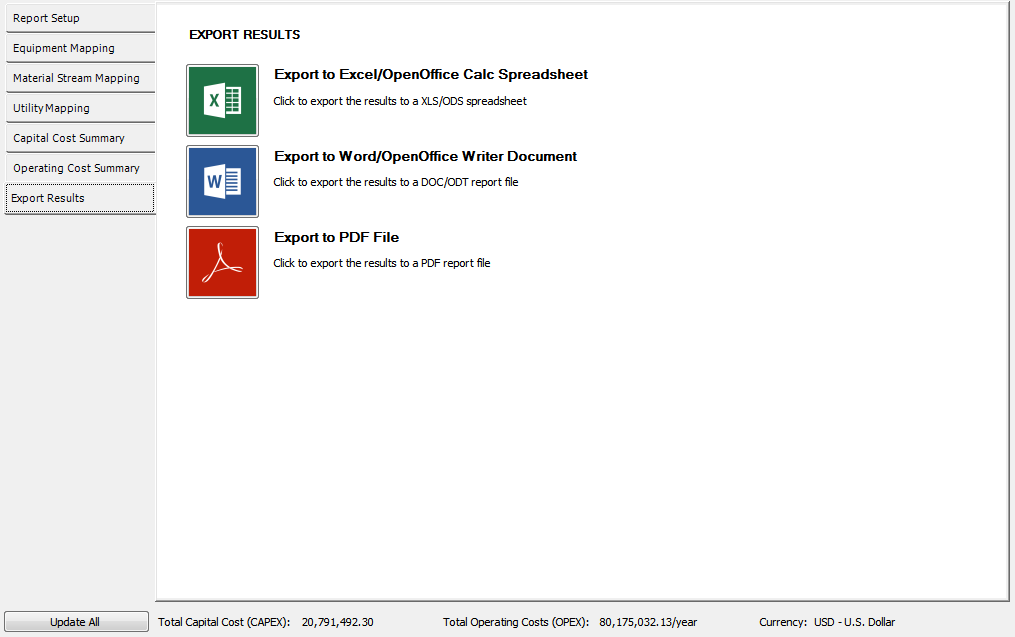
From this tab you can export the calculated results to a document file (DOC, ODT, PDF) or a spreadsheet file (XLS, ODS).
User-Defined Equipments, Materials and Utilities
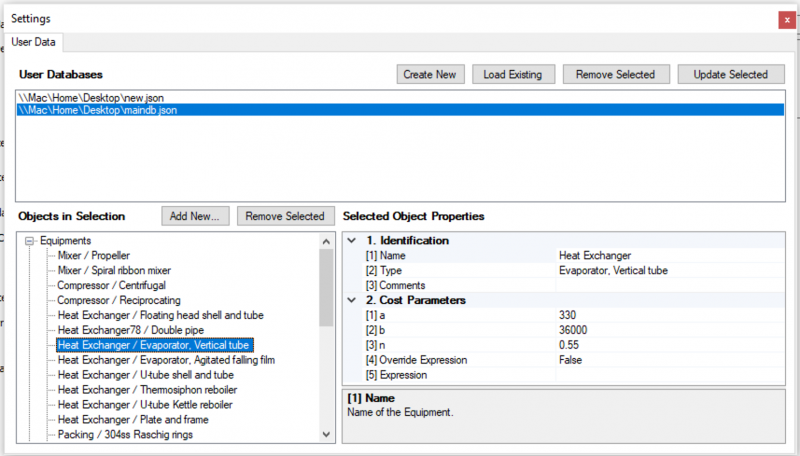
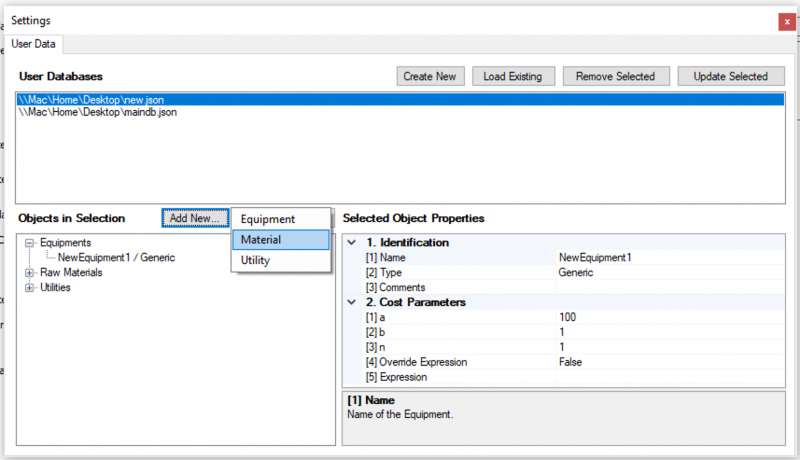
Starting with v2.0, you can define additional Equipments, Materials and Utilities and save them on user databases (JSON files). User-defined equipments can have their cost calculation basis overriden by a general expression which takes the equipment size as the expression variable.
To access the User Database editor, click on the small cog toolbar button.
Cost Estimation Basis
Most of the calculation methods on this plugin are based on the Factorial Method described on the Chemical Engineering Design book by R. K. Sinott [1], which you should refer to for more information.
Introduction
Cost estimation is a specialised subject and a profession in its own right. The design engineer, however, needs to be able to make quick, rough, cost estimates to decide between alternative designs and for project evaluation. Chemical plants are built to make a profit, and an estimate of the investment required and the cost of production are needed before the profitability of a project can be assessed.
Accuracy and Purpose of Capital Cost Estimates
The accuracy of an estimate depends on the amount of design detail available: the accuracy of the cost data available; and the time spent on preparing the estimate. In the early stages of a project only an approximate estimate will be required, and justified, by the amount of information by then developed.
Capital cost estimates can be broadly classified into three types according to their accuracy and purpose:
- Preliminary (approximate) estimates, accuracy typically 30 per cent, which are used in initial feasibility studies and to make coarse choices between design alternatives. They are based on limited cost data and design detail.
- Authorisation (Budgeting) estimates, accuracy typically 10 15 per cent. These are used for the authorisation of funds to proceed with the design to the point where an accurate and more detailed estimate can be made. Authorisation may also include funds to cover cancellation charges on any long delivery equipment ordered at this stage of the design to avoid delay in the project. In a contracting organisation this type of estimate could be used with a large contingency factor to obtain a price for tendering. Normally, however, an accuracy of about š5 per cent would be needed and a more detailed estimate would be made, if time permitted. With experience, and where a company has cost data available from similar projects, estimates of acceptable accuracy can be made at the flow-sheet stage of the project. A rough P&I diagram and the approximate sizes of the major items of equipment would also be needed.
- Detailed (Quotation) estimates, accuracy 5-10 per cent, which are used for project cost control and estimates for fixed price contracts. These are based on the completed (or near complete) process design, firm quotations for equipment, and a detailed breakdown and estimation of the construction cost.
The cost of preparing an estimate increases from about 0.1 per cent of the total project cost for 30 per cent accuracy, to about 2 per cent for a detailed estimate with an accuracy of š5 per cent.
Cost Escalation (Inflation)
The cost of materials and labour has been subject to inflation since Elizabethan times. All cost-estimating methods use historical data, and are themselves forecasts of future costs. Some method has to be used to update old cost data for use in estimating at the design stage, and to forecast the future construction cost of the plant.
The method usually used to update historical cost data makes use of published cost indices. These relate present costs to past costs, and are based on data for labour, material and energy costs published in government statistical digests.
Chemical plant cost indexes are dimensionless numbers employed to updating capital cost required to erect a chemical plant from a past date to a later time, following changes in the value of money due to inflation and deflation. Since, at any given time, the number of chemical plants is insufficient to use in a preliminary or predesign estimate, cost indexes are handy for a series of management purposes, like long-range planning, budgeting and escalating or de-escalating contract costs.[2]
A cost index is the ratio of the actual price in a time period compared to that in a selected base period (a defined point in time or the average price in a certain year), multiplied by 100. Raw materials, products and energy prices, labor and construction costs change at different rates, and plant construction cost indexes are actually a composite, able to compare generic chemical plants capital costs.
Calculation methods
Although the available indexes are compiled in several ways, they are defined to encompass a specific set of conditions and items. Prices for these items can be obtained either through company’s purchasing department data or through published indexes, like those published by the Bureau of Labor Statistics (BLS).[3] Both the CE and the IC indexes, from Chemical Engineering and Intratec, respectively, employs BLS’ data.
The weighting of such factors, which is defined by the realized degree of importance of each component in the specific index (or sub-index), aims to represent the costs variations typically found for chemical plants.
Using a cost index
To update an item cost (equipment, projects) from period A to period B, is necessary to multiply period A’s cost by the ratio of period B’s index over period A’s index, according to the following equation:
[math]\text{Cost at B} = \text{Cost at A}\cdot \frac{\text{index at B }}{\text{index at A }}[/math]
As a rule-of-thumb, cost indexes permit fairly accurate estimates for cost escalation if the difference between period A and period B is less than 10 years. Differences between the actual equipment and labor prices and those predicted by the index tend to grow over the years, surpassing the typical error verified in budget-level estimates.[4][5]
Cost Indexes in Engineering
The selection of the proper index to use depends on the industry in which it is applied. For example, while CE, M&S or IC Index are typically employed for chemical process industries, the ENR (Engineering News-Record) construction index is used for general industrial construction and takes in account the prices for fixed amounts of structural steel, cement, lumber and labor.
The majority of cost indexes demonstrate a time lag, due to data collection and its compilation for publishing. As stated before, some indexes use information published by other organizations and a delay in data may be verified (like those provide by the BLS). Exceptions to this are the ENR construction and the IC indexes, which present relatively current values.
The main indexes available for process industries include:
- Chemical Engineering Index, CEPCI: composed of 4 major components – equipment, construction labor, buildings, and engineering and supervision – the index is employed primary as a process plant construction index, was established using a base period of 1957-1959 as 100. The CE Index is updated monthly and it lags in time by about 3 months. The CE Index was revised in 1982, to account for changes in labor productivity and, again, in 2002.[6] Published in each issue of Chemical Engineering.[7][8]
- Marshall and Swift Cost Index, M&S (originally known as Marshall and Stevens Index): a composite of two major components - process-industry equipment average and all-industry equipment average - was established in 1926 with a value of 100. Some industries considered in the process-industry equipment average are chemicals, petroleum products, rubber and paper. The all-industry average encompasses 47 different types of industrial, commercial and housing equipment. Published monthly in each issue of Chemical Engineering until April 2012.[9]
Intratec Chemical Plant Construction Index, IPC: a process plant construction index developed by Intratec, a chemical consulting company. Although cost indexes do not usually forecast future escalation, the IC Index stands out for presenting a smaller delay between release date and index date, besides a 12 months forecast. On the other hand, the index is only available from January 2000 (with a value of 100). A sample is available at Intratec’s website.[10]
- Nelson-Farrar Indexes, NF (originally known as the Nelson Refinery Construction Indexes): established in 1946 with a value of 100, the index is more suitable for petroleum or petrochemical business. Published once a month in the Oil and Gas Journal.
Location Factor In order to be able to use the available standard indexes to locations where index data is not available we have to incorporate a new term called the Location Factor (LF) to the standard index value. It is a dimensionless value for a particular location relative to either of the above-mentioned basis:
[math]\text{Cost in A} = \text{Cost in USGC} \cdot \text{LF(A)}[/math]
where A is the location for which cost is being evaluated and LF(A) is the location factor for the location A relative to USGC.
Location factors are greatly influenced by currency exchange rates due to their significant effect on Index value and hence vary drastically with time. Over the past couple of decades the location factors for various locations are trending close to the value 1. However location factor for a particular region within a country can be easily determined by adding 10% to the index of the reference location for every 1000 miles. The reference location is usually a major industrial location closest to the location where the index is being determined. Location factors for various locations have been published and updated in various journals as in Aspen Richardson's "International Construction Cost Factor Location Manual (2003)".
The Factorial Method for Capital Cost Estimation
Capital cost estimates for chemical process plants are often based on an estimate of the purchase cost of the major equipment items required for the process, the other costs being estimated as factors of the equipment cost. The accuracy of this type of estimate will depend on what stage the design has reached at the time the estimate is made, and on the reliability of the data available on equipment costs. In the later stages of the project design, when detailed equipment specifications are available and firm quotations have been obtained, an accurate estimation of the capital cost of the project can be made.
Lang factors
The factorial method of cost estimation is often attributed to Lang (1948). The fixed capital cost of the project is given as a function of the total purchase equipment cost by the equation:
[math]Cf_D = f_L \cdot C_e[/math]
where [math]Cf_D[/math] is fixed capital cost, [math]C_e[/math] is the total delivered cost of all the major equipment items: storage tanks, reaction vessels, columns, heat exchangers, etc. and [math]f_L[/math] is the Lang factor, which depends on the type of process.
The values given above should be used as a guide; the factor is best derived from an organisation’s own cost files.
The above equation can be used to make a quick estimate of capital cost in the early stages of project design, when the preliminary flow-sheets have been drawn up and the main items of equipment roughly sized.
Detailed factorial estimates
Direct costs
To make a more accurate estimate, the cost factors that are compounded into the “Lang factor” are considered individually. The direct-cost items that are incurred in the construction of a plant, in addition to the cost of equipment are:
- Equipment erection, including foundations and minor structural work.
- Piping, including insulation and painting.
- Electrical, power and lighting.
- Instruments, local and control room.
- Process buildings and structures.
- Ancillary buildings, offices, laboratory buildings, workshops.
- Storages, raw materials and finished product.
- Utilities (Services), provision of plant for steam, water, air, firefighting services (if not costed separately).
- Site, and site preparation.
The contribution of each of these items to the total capital cost is calculated by multiplying the total purchased equipment by an appropriate factor. As with the basic “Lang factor”, these factors are best derived from historical cost data for similar processes. Typical values for the factors are given in several references, Happle and Jordan (1975) and Garrett (1989). Guthrie (1974), splits the costs into the material and labour portions and gives separate factors for each. In a booklet published by the Institution of Chemical Engineers, IChemE (1988), the factors are shown as a function of plant size and complexity.
The accuracy and reliability of an estimate can be improved by dividing the process into sub-units and using factors that depend on the function of the sub-units; see Guthrie (1969). In Guthrie’s detailed method of cost estimation the installation, piping and instrumentation costs for each piece of equipment are costed separately. Detailed costing is only justified if the cost data available are reliable and the design has been taken to the point where all the cost items can be identified and included.
In addition to the direct cost of the purchase and installation of equipment, the capital cost of a project will include the indirect costs listed below. These can be estimated as a function of the direct costs.
Indirect costs
Design and engineering costs, which cover the cost of design and the cost of “engineering” the plant: purchasing, procurement and construction supervision. Typically 20 per cent to 30 per cent of the direct capital costs. Contractor’s fees, if a contractor is employed his fees (profit) would be added to the total capital cost and would range from 5 per cent to 10 per cent of the direct costs. Contingency allowance, this is an allowance built into the capital cost estimate to cover for unforeseen circumstances (labour disputes, design errors, adverse weather). Typically 5 per cent to 10 per cent of the direct costs.
Operating Costs
An estimate of the operating costs, the cost of producing the product, is needed to judge the viability of a project, and to make choices between possible alternative processing schemes. These costs can be estimated from the flow-sheet, which gives the raw material and service requirements, and the capital cost estimate.
The cost of producing a chemical product will include the items listed below. They are divided into two groups.
- Fixed operating costs: costs that do not vary with production rate. These are the bills that have to be paid whatever the quantity produced.
- Variable operating costs: costs that are dependent on the amount of product produced.
Fixed costs
- Maintenance (labour and materials).
- Operating labour.
- Laboratory costs.
- Supervision.
- Plant overheads.
- Capital charges.
- Rates (and any other local taxes).
- Insurance.
- Licence fees and royalty payments.
Variable costs
- Raw materials.
- Miscellaneous operating materials.
- Utilities (Services).
- Shipping and packaging.
The division into fixed and variable costs is somewhat arbitrary. Certain items can be classified without question, but the classification of other items will depend on the accounting practice of the particular organisation.
The items may also be classified differently in cost sheets and cost standards prepared to monitor the performance of the operating plant. For this purpose the fixed-cost items should be those over which the plant supervision has no control, and the variable items those for which they can be held accountable.
The costs listed above are the direct costs of producing the product at the plant site. In addition to these costs the site will have to carry its share of the Company’s general operating expenses. These will include:
- General overheads.
- Research and development costs.
- Sales expenses.
- Reserves.
- How these costs are apportioned will depend on the Company’s accounting methods. They would add about 20 to 30 per cent to direct production costs at the site.
References
- Gavin Towler, R. K. Sinnott: Chemical Engineering Design 2nd Edition, https://www.elsevier.com/books/chemical-engineering-design/towler/978-0-08-096659-5
- Pintelon, L. & Puyvelde, F. V., 1997. Estimating Plant Construction Costs. Chemical Engineering, August, pp. 98-104
- Humphreys, K. K., 2005. Project and Cost Engineers' Handbook. 4th ed. s.l.:Marcel Dekker
- Peters, M., Timmerhaus, K. & West, R., 2004. Plant Design and Economics for Chemical Engineers. 5th ed. s.l.:McGraw-Hill
- Vatavuk, W. M., 2002. Updating the CE Plant Cost Index. Chemical Engineering, January, pp. 62-70
- Couper, J. R., 2003. Process Engineering Economics. s.l.:Marcel Dekker
- Albright, L.. 2008. Albright's Chemical Engineering Handbook. s.l.:CRC-Press
- http://www.chemengonline.com/pci/
- http://www.equipment-cost-index.com/
- http://www.intratec.us/ic
